Well, if you're a climatologist, it's a calculated value based on a 30-year period, updated every 10 years. And the 19991-2020 climate normals for the US will come out this May. Meanwhile, the National Centers for Environmental Information (NCEI) has released some teaser images:
NOAA senior science writer Rebecca Lindsey explains:
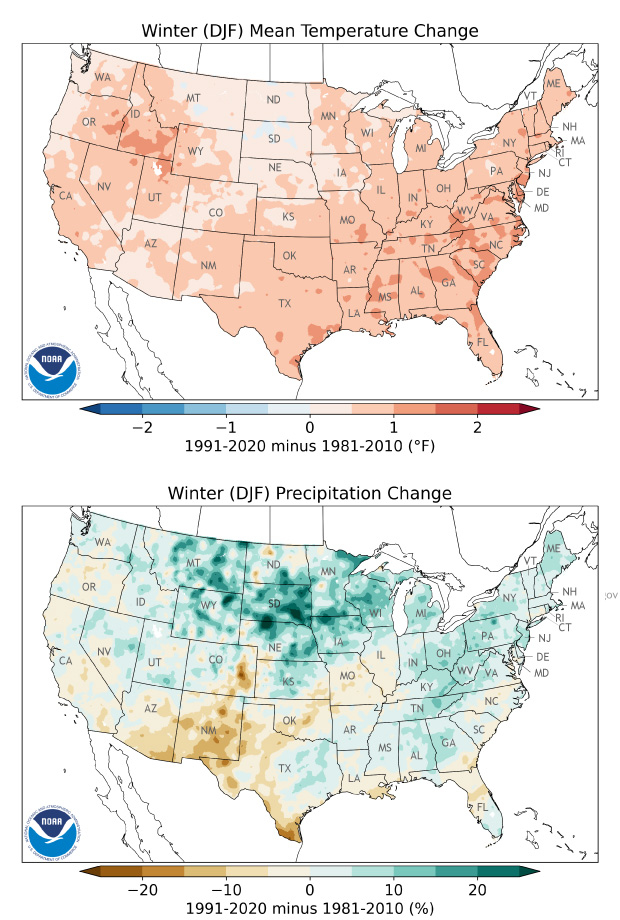
These images are a sneak peak at how the new normals for winter temperature (top) and precipitation (bottom) are different from the current normals, which cover 1981-2010. Consistent with the long-term warming trend, winter is warmer across most of the contiguous United States, but the amount of warming ranges from nearly 0.0 (light pink) to 1.5 degrees [Fahrenheit] (darker pink) Fahrenheit depending on the location. There are even a few small areas of the Northern Plains where the normal winter temperature for 1991-2020 is slightly cooler than the 1981-2010 normal (light blue).
There’s a lot more variation in the changes in winter precipitation, which includes both rain and snow. The map shows the percent difference in normal winter precipitation in the new normal versus the old normals. The Northern Plains and Upper Midwest have seen the biggest percent increases in normal winter precipitation, while the biggest percent decreases occurred in the Southwest and Southern Plains, including Colorado’s Eastern Plains. (In absolute terms, these changes are equivalent to only fractions of an inch of liquid water because these locations are normally quite dry during the winter.)
Having seen other preliminary data, I expect that the December temperature normals will be the most surprising. Also, NCEI will prepare a second full set of 15-year normals covering 2006-2020 as well. It wasn't reported whether NCEI will produce 15-year normals on a 5-year schedule, however.